Mapping Return Levels of Absolute NDVI Variations for the Assessment of Drought Risk in Ethiopia
Objectives
Enhance existing approaches for the quantification of drought risk in third-world countries by applying raster-based extreme value models
Implementing an easy-to-use, statistically sophisticated, and flexible algorithm to facilitate use with other indicators in future applications
Research Team
Francesco Tonini, Dr. Giovanna Jona Lasinio, Dr. Hartwig H. Hochmair
Abstract
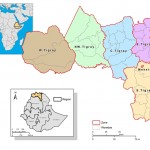
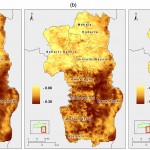
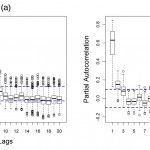
The analysis and forecasting of extreme climatic events has become increasingly relevant to planning effective financial and food-related interventions in third-world countries. Natural disasters and climate change, both large and small scale, have a great impact on non-industrialized populations who rely exclusively on activities such as crop production, fishing, and similar livelihood activities. It is important to identify the extent of the areas prone to severe drought conditions in order to study the possible consequences of the drought on annual crop production. In this study, we aim to identify such areas within the South Tigray zone, Ethiopia, using a transformation of the Normalized Difference Vegetation Index (NDVI) called Absolute Difference NDVI (ADVI). Negative NDVI shifts from the historical average can generally be linked to a reduction in the vigor of local vegetation. Drought is more likely to increase in areas where negative shifts occur more frequently and with high magnitude, making it possible to spot critical situations. We propose a new methodology for the assessment of drought risk in areas where crop production represents a primary source of livelihood for its inhabitants. We estimate ADVI return levels pixel per pixel by fitting extreme value models to independent monthly minima. The study is conducted using SPOT-Vegetation (VGT) ten-day composite (S10) images from April 1998 to March 2009. In all short-term and long-term predictions, we found that central and southern areas of the South Tigray zone are prone to a higher drought risk compared to other areas.
The Geomatics lab analyses a wide range of big data sources, including social media, online reviews, citizen science platforms, news channels, online searches, crowdsourced drone and street imagery, and collaborative mapping platforms to explore and model human activity patterns (e.g., visitation of and activities in State parks), travel behavior (e.g., in response to natural disasters) and user sentiments (e.g., perception of locations or events). Social media networks provide an enormous volume of shared data with hundreds of millions (Twitter) or billions (Facebook) of daily active users. Despite this enormous data volume research is needed to assess the data quality and potential bias of big data to better understand and capture its usability for geo-applications. Big data can be used for the spatio-temporal analysis of human activity patterns.
This includes a) the modeling of refugee migration patterns, b) the extraction of travel behavior (e.g., rescue teams being dispatched to locations of natural disasters), c) the identification of factors associated with increased levels of outdoor activities (i.e., hiking, running, cycling, kayaking) in recreational parks or urban areas, or d) the use of shared photographs to determine the impact areas of natural disasters, such as hurricanes or floods.
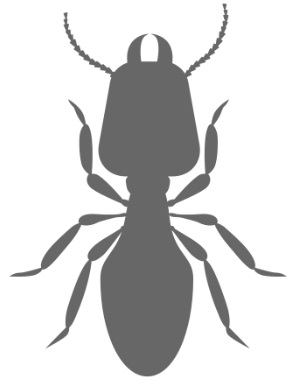
The Geomatics lab uses local collections of invasive species, such as termites or tegus, and databases generated from collaborative mapping projects, such as iNaturalist or eBird, to collaborate with other departments at the FLREC in mapping and modeling the spread of invasive species. For example, it estimates through agent-based simulation models how fast an invasive termite species naturally disperses from a newly infested area, which provides a means for regulatory agencies to anticipate possible areas of infestation around newly infested locations. It also evaluates the data quality of observations in citizen science projects and analyzes how natural events, such as pandemics or hurricanes, affect user contributions to such platforms.
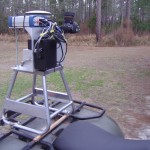
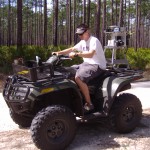
Mobile Mapping Beneath Forest Canopy: System Development and Application
Objectives
Develop a mobile terrestrial mapping system for use in a forested environment
Research Team
Adam Benjamin, Tolee Mamatas, Ahmed Mohamed, Ben Wilkinson
Abstract
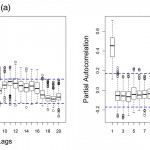
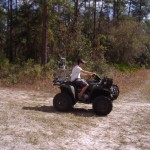
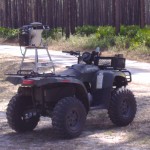
The development and application of a Mobile Mapping System (MMS) beneath forest canopy is investigated. Contemporary forest managers are challenged to make efficient decisions in a short amount of time and based on as much information as possible. Terrestrial MMS can provide this geospatial data at reasonable cost and fast turn-around time. MMS development onboard an All-Terrain Vehicle was explored first through integration and testing of the georeferencing (GPS/INS) and imaging subsystems. To determine the impact that forest canopy had on GPS signal reception and positioning, the relationship between GPS positioning precision and canopy density was analyzed. In areas where MMS position and orientation precision was poor, vision-aiding was explored as a means for improving these navigation parameters for future mapping applications. Through simulation and processing of field collected data sets, a vision-aiding algorithm was developed to improve the position and orientation of the MMS.
Literature
In progress
Photo Gallery
The Geomatics lab identifies which environmental factors and road network design characteristics encourage alternative modes of transportation (walk, bike, transit) that mitigate congestion and come with health benefits. It further uses crowd-sourced data, such as social media data or records from sport tracking apps to model human mobility patterns in transportation networks, such as cyclist route choice behavior and to analyze the usability of routes suggested by online routing planners and their provided routing criteria. The lab also models bicycle access distances to transit stations and suggests bicycle infrastructure improvements around transit hubs.
On the application side, the Geomatics labs has been collaborating with Florida International University to build bicycle routing apps for Palm Beach, Broward, and Miami-Dade counties.
Selected publications:
Schirck-Matthews, A., Hochmair, H. H., and Paulus, G. (2023). Identification of Structural, Environmental, and Socio-demographic Correlates of Outdoor Activities in Florida State Parks from Three Fitness Tracker Apps. Journal of Leisure Research.
Transportation Outreach Planner (Miami-Dade County & Florida International University, co-PI)
2020-2022
Miami-Dade Urban Tree Canopy Change Analysis (Miami-Dade County, PI)
2020-2021
Mapping Miami-Dade Urban Tree Canopy (American Forests, PI)
2020-2021
UF/IFAS Equipment & Infrastructure Award (UF – CALS, PI)
2020
Transportation Outreach Planner (Miami-Dade County & Florida International University, co-PI)
2018-2020
Biodiversity Analysis via Citizen Science (UF Biodiversity Institute, co-PI)
2018-2019
Sea Level Rise Impact Web Tool (City of Coral Gables & Florida International University, co-PI)
2017-2018
Miami Urban Tree Canopy Analysis (American Forests, PI)
2015-2016
Miami-Dade Bicycle Planning Project (phase 3) – An Interactive Web Application for Miami-Dade County Bicycle Route Planning (Contract with Miami-Dade County, PI)
2015
Field trials to evaluate herbicide efficacy on rotala (Rotala rotundifolia) and crested floatingheart (Nymphoides cristata) (South Florida Water Management District, Co-PI)
2014-2015
Analysis of Travel Behavior and User Contribution Patterns from Volunteered Geographic Information (IFAS Dean’s Office)
2014
Palm Beach Bike – An Interactive Web Application for Palm Beach County Bicycle Trip Planning Phase 2 (Contract with Palm Beach MPO, PI)
2012-2013
Miami-Dade Bicycle Planning Project (phase 2)- An Interactive Web Application for Miami-Dade County Bicycle Route Planning (Contract with Miami-Dade County, PI)
2012-2013
Computation of Scenic Routes in Street Networks (Google Research Award, PI)
2010-2011
Miami-Dade Bicycle Planning Project – An Interactive Web Application for Miami-Dade County Bicycle Route Planning (Contract with Miami-Dade County MPO, PI)
2010
Palm Beach Community Indicator Portal Planning (Contract with Quantum Foundation, co-PI)
2009-2010
Measuring the Structure of Multi-Modal Transportation Networks for the Prediction of Travel Behavior and System Performance in Florida (Contract with Florida Department of Transportation, PI)
2008-2009
Bicycle Knowledge Explorer (BiKE) – An Interactive Web Application for Broward County Bicycle Route Planning (Contract with Broward County, co-PI)
2008-2010
The Geomatics lab uses drones and other off-the-ground sensors to collaborate on interdisciplinary research between geospatial mapping, phycology, plant pathology, and turfgrass science, including monitoring of aquatic plants, invasive shrubs and trees, and measuring the efficacy of chemical and biological control.
One study, for example, investigated the use of unmanned aerial systems mapping for monitoring the efficacy of invasive aquatic vegetation (AV) management on a floating‐leaved AV species, Nymphoides cristata (crested floating heart, (CFH)), comparing RGB with multispectral sensors for detection at different elevations above ground.